RETAIL
Define Primary and Secondary Trade Areas
Background
A shoe store in north Toronto wanted to identify its primary and secondary trade areas so it could tailor its product offerings and marketing to its core customer base.
Analytic Objectives
The objective of analytics was to:
- Identify primary and secondary trade areas
- Perform customer profile analysis and compare with the trade areas to identify gaps and potential opportunities.
Manifold’s Approach
Based on a list of postal codes with total sales, we used the Gravity Model in PolarisIntelligence.com and derived a circle around the store that accounts for 60% of total sales. This defines the Primary trade area of the store. Similarly, the circle with 80% of total sales defined the Secondary trade area of the store. Once these trade areas were defined, we were able to compare the store’s customer profile with the trade area profile to identify gaps and potential opportunities for growth.
Manifold’s Data Products Used in Custom Profiling
- Manifold’s data products on consumer psychographics, lifestyles, and product usage patterns helped the client gain insight on its core customers and trade areas.
- In particular, the data product on Consumer Media Usage Patterns helped the client identify media channels to engage more efficiently with different groups of customers.
- The data product on Consumer Shopping Behaviour at Shoe Stores enhanced the client’s analysis of its competitors.
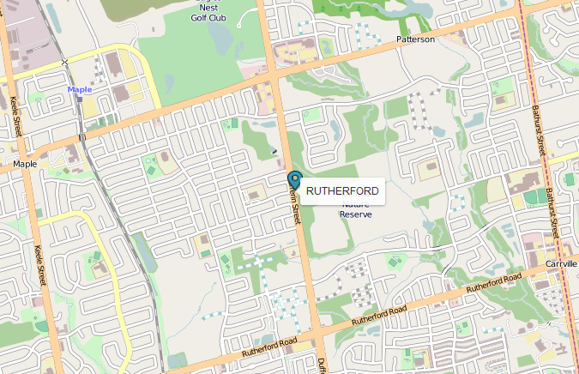
Primary Trade Area (60% of Sales)
The map illustrates the primary trade area (10KM) with core customers concentrated on the east side of the store.

Secondary Trade Area (80% of Sales)
The map illustrates the secondary trade area (15KM) of the store.
