RETAIL
Targeting the Best Billboards

Background
A pet food manufacturer wants to promote selected pet foods through outdoor media. They want to use digital media to target the best prospects at proper dates and times for pet stores.
Analytic Objectives
The objective of analytics was to identify the best billboards in terms of consumer movement patterns, income, and pet ownership, while considering pet store and billboard locations.
Manifold’s Approach
Working with our data partner: Streetlight Data Inc. we extracted the movement data of consumers passing by digital billboards in Toronto, Montreal and Vancouver during seven parts of the day, for weekdays and weekends. The Origination Dissemination Areas of the mobile data are linked to 6-digit postal codes for deriving the demographics, lifestyles, product usage, and psychographics of the catchment area of each billboard. Thereafter, we used pet owners, pet spending, and high income as criteria to target the best billboard by day parts. Overlaying pet store locations enabled us to identify the best billboard locations and day parts to promoting sales of the selected pet food at the right stores.
Dynamic Contents of Digital Billboards
Contents of digital billboards can be adapted for 7 different dayparts, weekdays and weekends. Each billboard has 14 different time intervals. Each time interval corresponds to a catchment area of the billboard because different groups of people pass by the boards for different time periods, e.g. the working population commutes during rush hour vs. consumers have leisure activities in the evening.
Each billboard thus has 14 different catchment areas (zones) with different types of consumers.
Catchment Area of Billboards
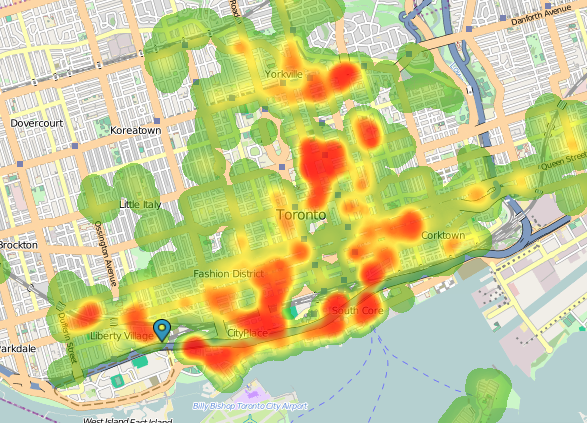
Based on Streetlight’s mobile data, we defined catchment areas for each billboard for different dayparts as well as for weekdays and weekends separately. For example, the map below shows the weekday catchment area of a billboard on the QEW near Exhibition Place facing East.
Targeting Prospects of High Spenders
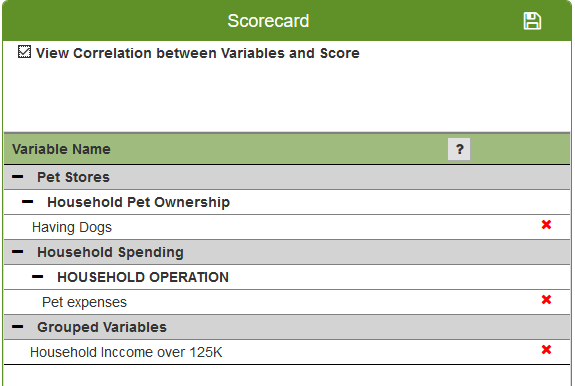
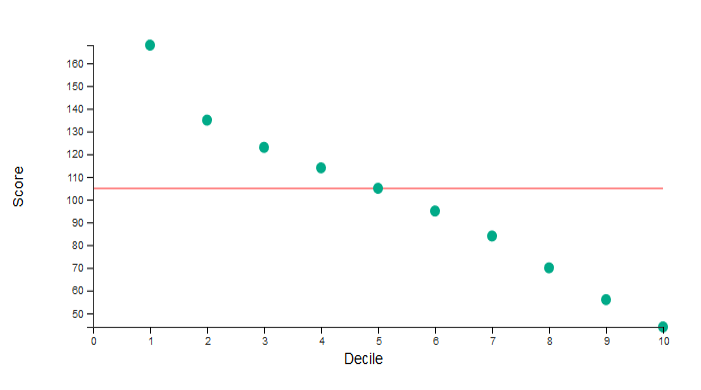
We targeted postal codes with household incomes over $120K, dogs ownership, and high pet spending as criteria. The top 10% of prospects are 70% better than the average as apparent in the lift chart below.
Best Prospects
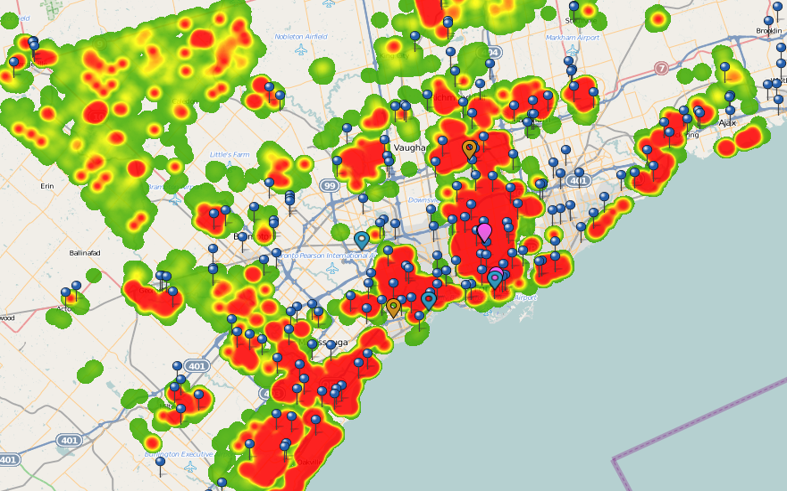
The map illustrates the geographic concentration of the top 10% of prospects, digital billboard locations, and pet store locations.
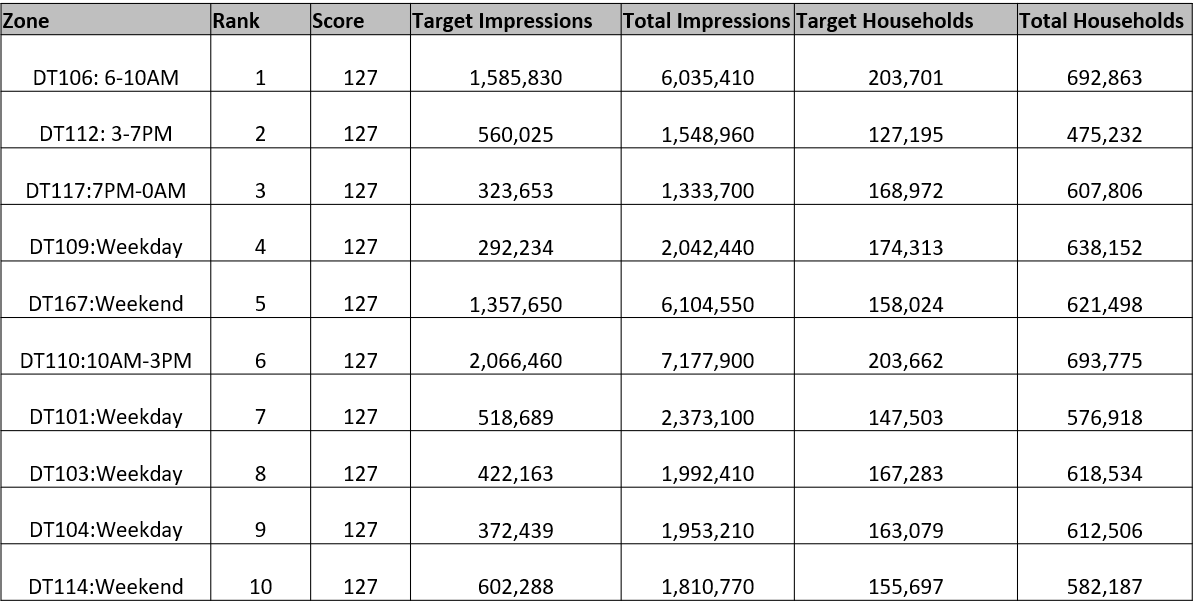
Best Billboards for Reaching Best Prospects
The Targeting module identified the best billboards to reach the best prospects at the right times.
Benefits of Using Polaris
- The heat map shows the dynamic catchment areas of the billboards.
- The client gained the ability to target the best prospects and reach them with the best billboards at the most suitable day and time.