When it comes to Canadian consumer data, precision and context matter—and that’s where Manifold excels. Unlike other data providers relying on broad averages or limited segmentation, Manifold delves into the nuances of Canada’s diverse economic landscape, delivering insights that truly reflect local realities.
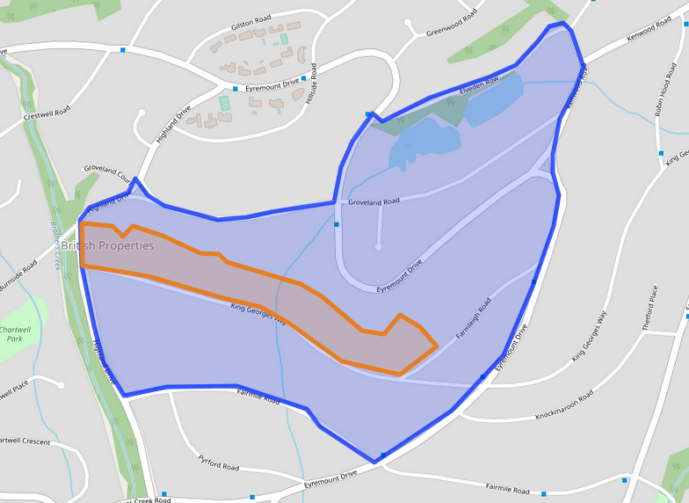
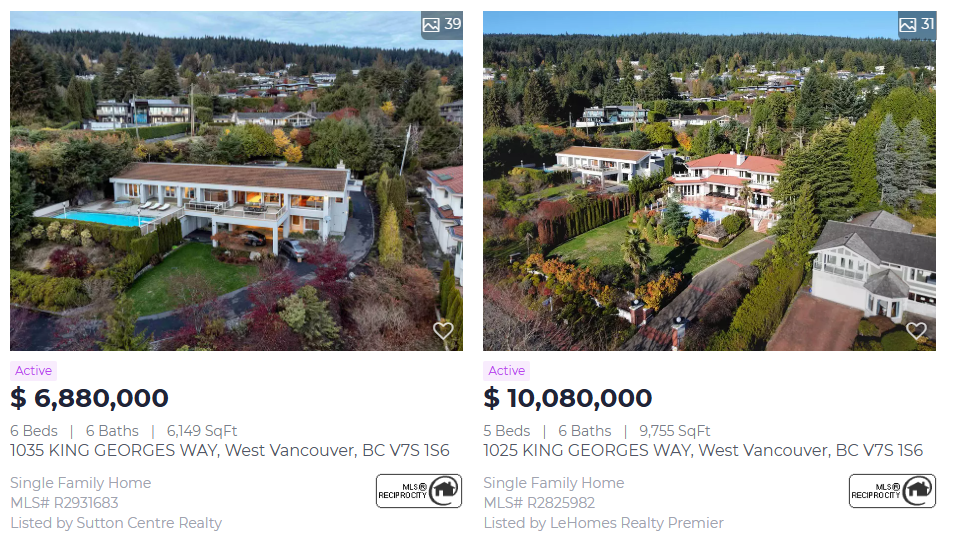
Take postal code V7S 1S6 in West Vancouver, for example. Manifold’s data estimates the average net worth for households in this postal code at $13.1 million, while a competitor’s model reports an average of just $2.1 million for the same area. This stark contrast in estimates highlights the limitations of data models that lack granularity. In an area where the minimum home price is $6.8 million, an estimate of only $2 million not only misses the mark but significantly underrepresents the actual wealth dynamics in this community. A homeowner in V7S 1S6 is likely to possess additional assets beyond their primary residence, making a low net worth estimate inaccurate and misleading.
What sets Manifold apart? A commitment to extreme granularity, regional insights, and a deep understanding of wealth composition. From leveraging hyper-localized data to factoring in diverse financial assets, our approach ensures accuracy and relevance at every level.
1. Extreme Granularity: Beyond Simplified Models
Manifold’s models bring precision to net worth estimation by using over 800,000 granular net worth estimates tailored specifically to each postal code across Canada. While competitors often assume all Canadians fit into a limited set of profiles, Manifold’s approach analyzes wealth at the postal code level. This allows our estimates to capture the economic diversity of even the smallest regions, producing results that closely align with actual conditions.
For instance, in postal code V7S 1S6, our model identifies that this high-net-worth neighbourhood cannot be accurately represented by a broad average. Other data providers might categorize this postal code within a “sophisticates” segment, estimating an average wealth of $2 million. In contrast, Manifold’s approach provides a more precise estimate of $13.1 million, a figure that better reflects the actual residents of this community. While the “sophisticates” segment could encompass 1% of Canada’s population (approximately 400,000 people) or more, Manifold’s estimate specifically pertains to the 21 households in V7S 1S6, offering a far more accurate assessment of the area’s wealth.

2. Localized Insights: Accounting for Regional Differences
Canada’s vast geography and economic diversity require a data approach that respects the unique characteristics of its regions. Yet, many data models treat these regions as homogeneous, grouping residents from cities like Toronto, Vancouver, and Montreal together and assuming they exhibit identical financial and consumer behaviours. This approach often overlooks critical local nuances, such as regional banking or shopping preferences.
For example, other data providers might assume that residents in both Toronto and Vancouver are equally likely to bank with Van City Credit Union, a Vancouver-based institution. However, Manifold’s models recognize that this institution primarily serves the Vancouver area, with far less relevance for Toronto residents. By integrating such localized insights, Manifold avoids broad generalizations and produces data that aligns closely with actual regional behaviours.
The same principle applies to grocery shopping habits. Many models might generalize that shoppers across Canada frequent national chains like Loblaws or Walmart, ignoring strong regional preferences. In Quebec, for instance, grocery chains like IGA and Metro dominate, while in British Columbia, Save-On-Foods holds a significant market share. Manifold’s localized approach accounts for these differences, ensuring data that reflects the unique consumer behaviours of each province and city.
This focus on regional distinctions allows Manifold to provide insights that are both precise and relevant, empowering clients to make informed decisions based on accurate representations of Canada’s diverse population.
3. Wealth Composition Matters: Going Beyond Home Values
One of the key advantages of Manifold’s approach is its consideration of wealth composition, especially at higher net worth levels. As households accumulate wealth, their financial portfolios tend to diversify significantly. While many Canadians may hold the majority of their net worth in their primary residence, households in the top 0.5% (with net worths of around $10 million or more) often have substantial portions of their wealth in financial assets such as investments, businesses, or inherited wealth.
For instance, in neighbourhoods like V7S 1S6, where home values range from $5 to $10 million, estimating an average net worth of $2 million fails to account for other significant financial assets. Manifold’s models incorporate a wide range of assets beyond home values, including additional real estate, stocks, bonds, pension plans, vehicles, valuable art collections, and antiques. This comprehensive approach enables us to produce net worth estimates that are not only more accurate but also reflective of the true financial composition of affluent households.

4. High-Quality Data Sources for More Reliable Insights
To provide the most predictive and privacy-compliant data in Canada, Manifold draws on a variety of inputs, including:
- MLS listings for real estate values,
- Bank of Canada financial data,
- CRA tax filer data,
- Census data,
- Statistics Canada financial surveys,
- Credit bureau data,
- And more.
We recognize that some data sources are more accurate than others—BC’s property assessments for tax purposes, for example, are generally more precise than those in Ontario. By carefully selecting our data inputs and considering their reliability, we ensure that our models remain accurate and responsive to regional differences across Canada.
The Manifold Advantage: Precision, Relevance, and Local Context
At Manifold, our mission is to provide the most accurate and predictive data solutions available in Canada. With an unmatched level of detail down to the postal code level, we go beyond averages and generalized segments to capture the full financial diversity within Canadian communities. By incorporating regional differences, high-net-worth wealth composition, and premium data sources, we produce insights that reflect the true economic landscape, empowering clients to make well-informed decisions.
Manifold’s data doesn’t simply present averages; it offers a targeted, specific, and accurate representation of the Canadian financial landscape, setting a new industry standard.
Check out our other blogs here → Canada’s Growing Population and the Role of Newcomers

