Introduction
Canada’s most affluent households cluster into a small group researchers call Cluster A1: Top Leaders. This segment makes up just 1% of Canadian households. Yet it reshapes real estate, retail, and philanthropy across the country.
Five neighbourhoods anchor this group: Shaughnessy Heights in Vancouver, Mount Royal in Calgary, Bridle Path in Toronto, Rockcliffe Park in Ottawa, and Westmount in Montreal. Each offers a distinct lens into extreme affluence.
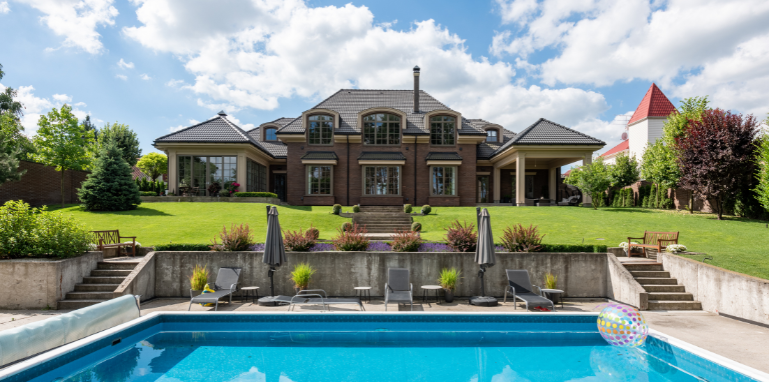
This post zooms in on one: Bridle Path. Toronto’s most exclusive enclave has drawn celebrities like Prince, Céline Dion, and Drake. Massive lots, some two to four acres, give residents privacy close to downtown Toronto. Beyond the mansions, though, the numbers tell a bigger story about how Cluster A1 households actually build and hold wealth.
Using Manifold data, we compare Bridle Path against the national benchmark across income, assets, education, and lifestyle. The gap is enormous. Then we set up the fuller picture: how Bridle Path stacks up against the other four Cluster A1 neighbourhoods.
Income and Assets
Bridle Path households earn $794,746 on average. Nationally, that figure sits at $119,810. Median household income tells a similar story: $249,069 in Bridle Path versus $91,590 across Canada.
But income only tells part of the story. Total assets in Bridle Path average $62,450,588 per household, compared to $1,160,673 nationally. Net worth, including pension, follows the same pattern: $60,680,636 versus $982,677. Business equity drives much of this gap. The average Bridle Path household holds $35,552,668 in business assets, dwarfing the national average of $97,553.
| Attribute | Benchmark CANADA |
Bridle Path Neighbourhood polygon |
|||
|---|---|---|---|---|---|
| Value | Percent | Value | Percent | Index | |
| ASSETS | |||||
| Total Assets, including real estate, stocks, bonds, and money itself | $1,160,673 | $62,450,588 | 5,381 | ||
| Total Assets: Median | $682,350 | $29,478,640 | 4,320 | ||
| Financial assets: Non pension | $150,330 | $10,416,149 | 6,929 | ||
| Financial assets: Private pension assets | $252,335 | $3,113,553 | 1,234 | ||
| Accumulation of total Registered Retirement Savings Plan | $106,328 | $2,430,943 | 2,286 | ||
| Accumulation of total Registered Retirement Income Funds (RIF) | $8,076 | $49,288 | 610 | ||
| Employer-Sponsored Registered Pension Plans (EPPs) | $135,835 | $544,092 | 401 | ||
| Asset value of other retirement funds, including deferred profit s… | $2,097 | $89,229 | 4,255 | ||
| Non-financial assets such as: a car, home or properties, art, jewel… | $673,125 | $14,224,909 | 2,113 | ||
| Real estate | $599,921 | $14,064,783 | 2,344 | ||
| Asset value of the principal residence | $499,754 | $7,627,313 | 1,526 | ||
| Asset value of all real estate other than principal residence | $100,167 | $6,437,470 | 6,427 | ||
| Vehicles and other non-financial assets | $73,204 | $160,126 | 219 | ||
| Vehicles owned: Asset value of vehicles (cars, trucks,… | $27,680 | $32,272 | 117 | ||
| The value of the contents of the principal residence, valuables | $45,523 | $127,854 | 281 | ||
| Business Equity: Total value of all business assets or properties | $97,553 | $35,552,668 | 36,444 | ||
| Net Worth Including Pension: Net worth of the household | $982,677 | $60,680,636 | 6,175 | ||
Capital vs. Salary: How Wealth Is Generated
The Real Estate Picture

Education Runs Deep
Beyond the Numbers
Conclusion: Unlocking Market Insights in Affluent Neighbourhoods
Bridle Path offers one clear window into Cluster A1, Canada’s wealthiest 1%. But it’s only one of five. Shaughnessy Heights, Mount Royal, Rockcliffe Park, and Westmount each tell their own version of this story, with different income levels, dwelling values, and lifestyle patterns.
Want the full picture? Explore how Bridle Path compares to four other elite Canadian neighbourhoods in our complete Cluster A1 breakdown.
Gain a Competitive Advantage with Polaris Intelligence
Understanding the spatial patterns, household spending, and lifestyle clusters of Canada’s most affluent neighborhoods delivers actionable location intelligence for businesses, real estate developers, and luxury retailers. Whether you are evaluating trade area analysis, refining your retail analytics, or optimizing targeted advertising, tapping into rich Canadian data at the postal code level is the key to identifying your highest-potential customers.
Behind the spatial insights and spending behaviors highlighted in this post is Manifold Data Mining and our proprietary platform, Polaris Intelligence.
With Polaris Intelligence, you can leverage geo-demographics, psychographics, and predictive data mining to drive smarter strategic decisions:
- Site Selection & Trade Area Mapping: Identify high-growth CSD, CMA, or FSA boundaries and perform precise site selection using custom drive time zones and heat map visualizations.
- Customer Profiling & Analytics: Analyze behavior data, shopping habits, and wealth and assets metrics to build accurate customer profiles and pinpoint local market potential.
- Precision Targeting: Go beyond traditional census data. Execute high-converting neighborhood marketing, direct mail, and location-based outreach backed by advanced customer analytics.