
Introduction
If you have ever tried to map out your Canadian consumer data or route a B2C campaign by postal codes, you have probably stared at the map in utter disbelief.
Take a look at the Forward Sortation Area (FSA) N0P, located in Southwestern Ontario, or K0A wrapping around Ottawa. On the map, these codes break into completely disconnected pieces. There are several different urban postal codes in the middle of these areas. This visual mess leads many analysts to believe Canada Post created these postal codes completely randomly.
If your business relies on spatial data for targeting customers, this apparent randomness can act as a trap. Relying on basic mapping assumptions can lead you to misread where your consumers truly live. Oftentimes, analysts unintentionally group urban consumers into rural spending models, or miss these localized shifts entirely.
In reality, Canada Post’s system follows a highly logical framework. Designers just never intended it for a map.
In this blog post, we will dive into the data anomalies that make Canadian postal codes look rather chaotic. We will look further into how Canada Post actually created these postal codes, and why understanding this distinction can significantly improve the accuracy of consumer data analysis.
The Anatomy of an FSA: Mail Sorting, Not Map Making
To understand the chaos, we must look at the rules of the Forward Sortation Area (FSA). An FSA represents the first three characters of a postal code. Canada Post utilizes a strict, structural formula for these characters.
- The first letter dictates the province or territory. For example, K and N cover parts of Ontario, and V represents British Columbia.
- The second character is always a number, containing the most important data clue. A zero (0) denotes a wide-ranging rural delivery area. On the other hand, numbers 1-9 signal a high-density, urban sorting zone.
- The third character of the FSA pinpoints a specific delivery district.
This system works flawlessly for automated postal conveyor belts. However, it creates major visual distortions on a geographic map.
The ‘Hole in the Donut’ Phenomenon
This rigid formula helps explain why rural FSAs often look so distorted on maps, containing many holes throughout. Let’s examine N0P (Southwestern Ontario) and K0A (near Ottawa).
Originally, these codes covered a massive, unbroken area of land. Over the past several decades, population pockets expanded rapidly. Small rural villages have transformed into bustling urban centers.
As communities grow and mail volumes increase, Canada Post may introduce new urban FSAs within previously rural regions through a process often referred to as “urbanization.” Instead of following a strict population threshold, they evaluate local delivery logistics individually. When they determine a change is needed, they carve a brand-new urban postal code out of the old rural zone, creating the fragmented patterns we observe today. For example, the urban code K2S sits right in the middle of K0A.
This operation creates a permanent “donut hole” effect within the FSA. A single street of homes can now hold completely different postal codes than its surrounding areas. It looks completely randomized on the map, even though it is simply the natural result of historical urban sprawl.
The ‘Split Personality’ of Disconnected Codes
The anomalies don’t stop at simple donut holes. Oftentimes, a single postal code exists in completely separated geographic fragments.
Consider N7M in Chatham as an example. When typing this FSA into Google Maps, viewers see a single shape highlighting the South side of the city. The North side appears as if it belongs entirely to other codes. Because of this, users can’t see the split on a standard consumer map.
Standard mapping platforms, such as Google Maps, are designed to draw neat, continuous geometric shapes. They cannot handle a single postal code label existing in two disconnected places. To keep the map “clean” and user-friendly, the software forces a choice. It ends up highlighting the largest main section, and hides the smaller pieces entirely. This can cause issues when analyzing data through standard consumer maps.
How to Uncover the Hidden Data
However, if you look past these visuals and check the individual addresses by clicking a specific area, you can discover the truth. Specific residential streets and delivery points on the far North side of Chatham hold N7M postal codes, which completely miss the original map highlighting the N7M location.
Simply stated, these patterns often emerge from the realities of the mailing process, transportation routes, and the delivery logistics. They do not rely on municipal borders, despite common belief. If it is more efficient for a delivery truck to service a small pocket of houses on the north side from the same central sorting line, Canada Post will give those houses the same code (in this case, N7M). The system is built around mail delivery, not the map visual.
The Quebec Mapping Glitch
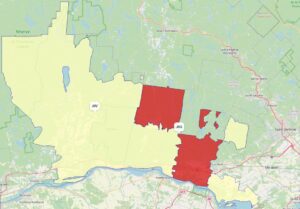
This issue persists throughout the country. Consider how consumer mapping software attempts to render FSA’s in Quebec, near Montreal. Take a look at how the J8G code splits into fragments. The same FSA covers the shape featuring Highway 50 at the bottom of the image, while jumping across borders to cover the completely disconnected polygon at the top left.
Why These Anomalies Break Traditional Data Analysis
These hidden quirks represent a massive roadblock for B2C companies attempting to run localized marketing campaigns. Standard consumer mapping tools often struggle with these irregular shapes.
Most basic mapping platforms assume that every postal code will form a neat, unbroken geometric polygon. When a platform encounters a split code like N7M, it gets confused. Because it cannot natively render a split shape, it sometimes ignores the smaller fragments completely, or drops pinpoints in random locations (sometimes even bodies of water) between the two actual locations.
If your business relies on basic maps to analyze household spending, you will miscalculate your reach. You may group urban spenders with rural data models accidentally, distorting your strategic insights.
The Real-World Cost
A premium grocery brand plans on launching a direct-mail flyer campaign or a localized digital ad drop. They wish to target high-income households with the use of household spending data.
The marketing team pulls a report for a massive, rural code: N0P. On average, the household spending average on food looks rather modest. Relying on this low broad average, the team chooses to skip this area entirely to save on advertising expenses.
However, a data blind spot hides within this circle. By skipping this entire area code, the brand completely misses the urban cluster that Canada Post has tucked inside of this geographic space. The company misses an area where household spending on groceries is substantially higher than the surrounding region. This opportunity is lost simply because those households were masked by the surrounding rural classification.
This is where standard analytics fail. When looking at broad data distributions or reliance on basic map shapes, we often miss the true pockets of opportunity within them. Outliers are not errors; they are often where the highest-value customers hide.
From Ghost Towns to the North Pole: The Ultimate Data Edge Cases
If you think the hidden urban pockets within N0P are confusing, Canada Post’s system has several legendary edge cases that completely break traditional mapping logic.
The ghost town of Ocean Falls, BC (V0T1P0): This town peaked in the 1950s. It was a booming company town which housed nearly 4,000 residents. However, when the local paper mill closed down permanently in 1980 (as it got outpaced by global competition), the entire population migrated. Today, it is practically deserted, and is now home to less than 30 full-year residents. However, its rural postal code remains on the books. Just like N0P, if an analyst relies on broad regional profiles without analyzing modern household distributions, they may waste marketing dollars targeting a consumer base that hasn’t existed in over 45 years.
The Santa Claus anomaly, (H0H 0H0): Created by Canada Post in 1982 to handle millions of children’s letters to Santa Claus, this code was a brilliant way to spread holiday cheer. However, by turning “H0H 0H0” into a functional code, Canada Post created an international mapping nightmare.
The first letter of the FSA, H, officially designates the region as urban Montreal. However, in reality, the physical mail is sent to a processing facility where volunteers answer letters. The geographic “location” of H0H 0H0 lands directly on the North Pole.
If an automated B2C marketing system enters H0H 0H0 as a placeholder, their basic mapping software will either crash, or will mistakenly plot a high-value consumer profile in Montreal. H0H 0H0 demonstrates the most famous example of a postal code whose symbolic purpose outweighs its geographic meaning. This global story is the ultimate proof that you cannot blindly trust a postal code to dictate geographic reality.
Looking Past the Map Grid
Canadian postal codes are excellent when it comes to logistics, but they were never designed to serve as consumer analytics boundaries. Canada Post designed them to move physical mail smoothly down conveyor belts. They fail to serve as flawless boundaries for modern digital marketing campaigns.
When B2C companies rely on surface-level mapping tools, these concealed geographic gaps distort their consumer insights. Canada Post views postal codes as flexible delivery paths, while regular map programs treat them like rigid squares on a grid.
Winning the data game requires looking very closely at the actual distribution of data, identifying the true boundaries, and hunting down the profitable outliers which are often hidden in plain sight.
Do you want to stop having to guess where your highest-value Canadian customers reside? Do not let basic mapping assumptions distort your marketing return on investment.
At Manifold Data Mining Inc., we specialize in mastering the deepest, most complex details of Canadian consumer data. We look past the standard geometric shapes to uncover the consumer insights that drive smarter targeting, stronger campaign performance, and more informed business decisions.
Discover how Manifold can transform your consumer analytics today.