
Inflation has been a dominant economic factor in recent years, significantly altering consumer behaviour and household spending across the country. As a data mining company, we provide comprehensive insights into these structural shifts, helping businesses understand and navigate the evolving economic landscape.
The spending figures and consumer insights featured throughout this analysis are sourced from the Polaris Intelligence platform, which provides detailed demographic, spending, and consumer behaviour data across Canada.
In this analysis, we examine how the post-COVID inflation shock fundamentally reshaped Canadian consumer spending and baseline housing values and what those lasting price adjustments mean for household expenditures today.
Growth in Spending: A Data-Driven Analysis
Overall Spending Trends
Despite economic challenges, consumer spending in Canada has shown resilience, with some sectors experiencing growth. Our data analysis indicates a marked increase in overall spending, though this growth is uneven across different sectors.
According to 2026 benchmark data, total annual household expenditure across Canada has reached $96,176 (with current consumption accounting for $74,291 per household). While annual price inflation has moderated from its peak, the cumulative price increases established over recent years continue to dictate household spending limits today.
Sector-Specific Insights
- Retail: Average annual retail spending per Canadian household stands at $16,327, with essential general merchandise taking up $10,970. Consumers continue prioritizing baseline goods over discretionary non-essentials.
- Housing: Shelter remains the largest annual expenditure for Canadian households at $24,965 on average, with homeowners paying an average of $8,422 in regular mortgage payments and renters allocating $4,275 annually toward rent.
- Services: Spending on controllables ($14,053/year) and discretionary items ($5,460/year) continues to be tightly managed as households balance lifestyle priorities against fixed shelter costs.
Food vs. Restaurant Spending
2026’s spending patterns didn’t appear overnight. Between 2019 and 2023, Canadians experienced one of the sharpest inflationary periods in decades. The following historical data illustrates how spending habits shifted during that period, helping explain why household budgets remain elevated today.
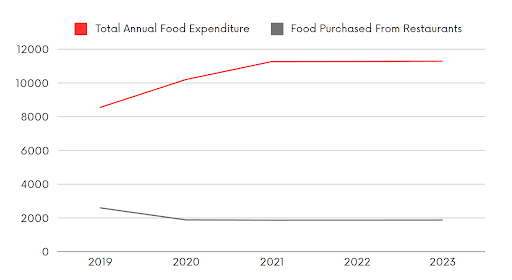
Historical Canadian Food Expenditure (2019-2023 Baseline)
Between 2019 and 2023, pandemic-related supply chain shocks pushed total annual food expenditure up to ~$11,300. Fast forward to 2026, and that structural pivot has solidified even further: total annual food spending per household has now reached $12,077 nationally (with $9,924 spent on groceries and $2,120 on restaurants).
Interestingly, fast-food spending ($589/year) and lunch dining ($595/year) command higher household volume than traditional sit-down dining, as time-strapped consumers seek cost-effective convenience. Across the board, Canadian households average approximately 135 restaurant meals per year.
Toronto: A Case Study
Prolonged inflation and elevated living costs have created stark regional divides in household budgets across Canada. Metropolitan areas like the Greater Toronto Area (GTA) face significantly heavier financial pressure compared to national averages, with total annual spending per household reaching $108,246, which is 13% higher than the national baseline of $96,176.
The Shelter Burden
Toronto households allocate an average of $29,494 annually to shelter—18% above the national average of $24,965.
In macro household spending reports, total shelter averages are split across different housing arrangements:
- Owned Living Quarters: Toronto homeowners spend $16,871 annually on principal housing costs (21% higher than the national average), driven primarily by regular mortgage payments averaging $10,628 (26% above national) and property taxes at $2,118 (27% above national).
- Rented Living Quarters: Toronto renters spend an average of $5,253 annually on principal shelter (20% higher than national), with base rent averaging $5,156 (21% above national).
Food & Dining Out
Total annual food expenditures in Toronto average $12,763 (6% higher than the national benchmark of $12,077):
- Groceries: Toronto households spend $10,613 annually on store-bought food (7% above national), with notable surges in seafood (+45%), fresh fruit/nuts (+29%), and fresh vegetables (+21%).
- Restaurants & Dining: Dining out averages $2,132 per year, matching the national average ($2,120). However, Torontonians rely significantly more on online food delivery, spending $756 annually—40% above the national benchmark ($541).
Taxes & Mandatory Deductions
The hidden cost driver for Toronto households isn’t just lifestyle—it’s taxes and fixed obligations:
- Personal Income Taxes: Toronto households pay an average of $17,790 in personal taxes, 29% higher than the Canadian average ($13,791).
- Pension & RRSP: Torontonians contribute $6,739 to personal insurance and pension funds (+15%) and $4,147 to RRSPs (+20%).
Additional Notable Pressure Points
- Education: Higher education costs hit Toronto hard, with average spending reaching $2,434 annually—34% above national benchmarks.
- Child Care: Outside-the-home child care expenses (daycare centres) average $460 annually per household in the GTA, running 33% higher than the rest of the country.
- Auto Insurance: While overall vehicle transportation spending is close to national averages, Toronto drivers pay $2,004 in annual auto insurance—29% higher than the national baseline ($1,548).
The Role of Data in Navigating Inflation
- Predictive Analytics: Predictive analytics play a crucial role in helping businesses forecast future spending trends and make informed decisions. By leveraging historical data and current trends, companies can anticipate market shifts and adjust their strategies accordingly.
- Consumer Behaviour Analysis: Understanding changes in consumer behaviour and preferences during inflationary periods is essential. Our data-driven insights enable businesses to identify these shifts and adapt their offerings to meet evolving consumer needs.
- Customized Solutions: Tailoring data insights to meet the specific needs of different industries and businesses is vital. Whether you are in retail, real estate, healthcare, or another sector, our customized data solutions provide the precise information you need to stay competitive.
Conclusion
Inflation presents both challenges and opportunities for businesses. By leveraging our comprehensive data insights, companies can better understand and adapt to the changing economic environment. One reason why Canadians are struggling is that wages and earnings have not kept pace with price pressures, especially those related to food and shelter.
This disparity highlights the importance of making data-driven decisions to navigate these challenging times. Whether you are looking to optimize your pricing strategy, adjust your inventory, or understand consumer behaviour, our data mining services provide the tools you need to succeed.
At Manifold Data Mining, we help organizations transform complex consumer and market data into actionable insights. Whether you’re analyzing spending trends, evaluating regional markets, or identifying new business opportunities, our data solutions provide the intelligence needed to make confident decisions. Explore our services or contact us to learn how we can support your organization.