Did you know that Census geographic boundaries can change from year to year? Over the span of 2016 and 2021, a total of 1,000 Census Subdivisions (CSDs) underwent changes in their boundaries or names. This had a significant impact on most CMA population estimates. These population estimates are critical in many sectors, including economic planning, resource allocation, urban development, healthcare, and policymaking. These estimates serve as a compass to guide businesses in predicting demand, assisting governments in allocating resources, informing labour force projections, and shaping investment decisions.
Boundary and Name Changes
A Census subdivision (CSD) refers to municipalities (as determined by provincial/territorial legislation) or areas treated as municipal equivalents, such as Indian reserves, Indian settlements, and unorganized territories. The way the Census divides these areas is crucial in counting populations within CMAs (Census metropolitan areas). Notably, the redefinition of Census Subdivision boundaries or names has increased the necessity for marketers, economic developers, and decision-makers to adopt a more precise approach to population counts to avoid basing critical decisions on potentially misleading information.
According to the 2021 Census data, 16 Census Metropolitan Areas (CMAs) in Ontario experienced population growth since the last Census in 2016. Remarkably, 8 of these CMAs ranked among the top 15 CMAs by population at the national level. However, the question that arises is whether the 2021 census data suggest a major influx of people moving to Census Metropolitan Areas. Contrary to widespread belief, the answer is negative!
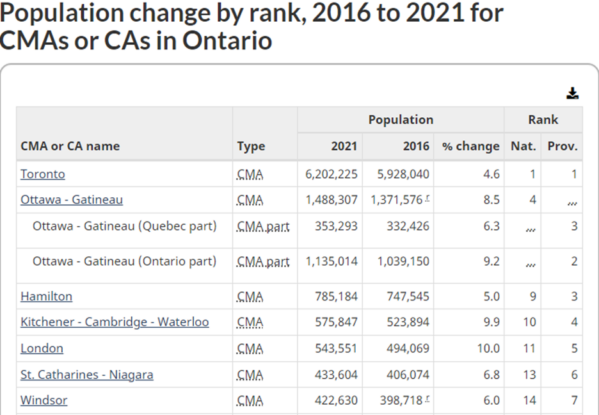
Let’s consider the case of the Ottawa-Gatineau CMA. According to The Interim List of Changes to Municipal Boundaries, Status and Names published by StatsCan, the Ottawa – Gatineau CMA expanded by 6 CSDs between 2016 and 2021. This expansion incorporates the former CAs of Arnprior and Carleton Place. The 2021 Census shows that the Ottawa-Gatineau CMA population grew by 8.5%. This growth is attributable to changes in geographic boundaries from the most recent Census, not more people moving to the area or higher birth rates. The table below displays CMAs that also experienced significant population variations based on the newest CMA and CSD definitions.

Additional boundary and name changes from the 2021 Census:
- Belleville, which became a CMA from CA in the 2016 Census, has changed its name to Belleville-Quinte West.
- Halifax CMA expanded by including the Municipal District of East Hants and the Indian Reserve of Indian Brook 14.
- Six former CAs underwent a change in classification and are now recognized as CMAs. Fredericton (N.B.), Drummondville (Que.), Red Deer (Alta.), Kamloops (B.C.), Chilliwack (B.C.), and Nanaimo (B.C.) were CAs in the 2016 Census but became CMAs in 2021.
- Sainte-Agathe-des-Monts (Que.), Amos (Que.), Essa (Ont.), Trail (B.C.), and Ladysmith (B.C.) have been designated to new CAs based on the 2021 Census. Each of these CA is named after its largest municipality.
- The Census Agglomerations of Bay Roberts (N.L.) and Cold Lake (Alta.) have been retired due to their core populations dropping below 10,000 in 2016.
The CMA of Windsor is another illustration of how changes to CSD boundaries can significantly impact population growth. From 2016 to 2021, Windsor’s population grew by 6%, ranking 14th in total population among CMAs nationwide. During this five-year span, Windsor expanded its jurisdiction by encompassing 3 additional CSDs: the town of Essex, the town of Kingsville, and the Municipality of Leamington.
On the other hand, CAs such as Brandon, Brockville, and Campbellton experienced a contrasting pattern, with one or more Census Subdivisions removed from their boundaries. Given the dynamic nature of CSDs, CAs, and CMAs in each census cycle, it is important for decision-makers to remain well-informed about the recent modifications to Census geography, including changes in boundaries and names.
Our 2023 estimates show a significant shift in population projections for Windsor’s CMA. In our previous projections, which were based on the older CSD boundaries and names, we estimated a total population of 338,659 for Windsor’s CMA for the five-year projections. However, after incorporating the latest CSD boundaries and names into our data, our data now indicates a 26% population growth for the CMA of Windsor. This growth in Windsor’s CMA population can undoubtedly be attributed to the inclusion of three additional CSDs, which has contributed to the CMA’s future population expansion.
Therefore, it is essential to incorporate these changes to ensure that you are using the latest Census geographies for more accurate population estimates. Unlike our competitors who still rely on outdated boundaries from the 2016 Census, we take pride in aligning our data with the latest boundary and incorporating the most recent Census. This ensures that our clients have access to the most current, precise, and reliable data.
Our data not only provides up-to-date insights but also enhances predictive accuracy and efficacy, empowering our clients to assess and evaluate current market demand and purchasing power, plan for future development projects over the next 5 to 10 years, and facilitate the formulation of robust growth strategies and effective economic plans.
We ensure our clients have the most current, accurate and precise data available. Our data is designed to generate high lift and achieve higher predictive power, for our clients to evaluate current market demand and purchasing power, to project future developments over the next 5- and 10-year periods, and to formulate effective growth strategies and economic plans.
Consider reading our other blogs to further explore the intersections of data and the Canadian landscape. Consider viewing our data products and feel free to book a call with our experts to learn more about how you can make use of our data with your business.

