
Part 2 of 3 – Social Determinants of Health
Good health is not only the absence of disease or injury but also physical, mental, and social well-being (CDC, 2016). Research shows that subjective measures of well-being status have clear links to health outcomes. In a meta review of 160 studies, Dominick et al (2002) found clear and compelling evidence that people experiencing better overall subjective well-being live longer than their less happy peers. In other words, the authors found that anxiety, depression, pessimism, and a lack of enjoyment of daily activities were all associated with higher rates of disease, and shorter lifespans. These key measures of well-being and Health Related Quality of Life (HRQoL) such as pain, social support, anxiety, health care experience and illness perceptions, reflect important aspects of health not captured in laboratory microscope measures.
Research studies by UK Whitehall (HP2020, 2016), (WHO, 2008) and Health Canada (CBPP, 2016) show that higher Socio-Economic Status (SES) is strongly associated with better outcomes and Health Related Quality of Life measures. The National Collaborating Centre for Infectious Diseases of Canada defines a new framework for measuring burden of diseases.

Well-being Outcome Clusters
To engage patients and their families in an improved care model, experts recognize that there are significant differences among patients in terms of goals, health literacy, the degree of control the patient is comfortable with and social/cultural circumstances. Distinct patterns of health perceptions and behaviours correlate with meaningful patient population clusters. Patients can be grouped into clusters with similar risks and health behaviours. This will help health care professionals more effectively and efficiently tailor their support, communication and improve outcomes. As an example, we considered the questions on the perceived health status and sentiment in the Canadian Community Health Survey (CCHS) and divided the patients with diabetes and/or heart disease into 7 clusters.

We used a gradient chart of key health indicators to illustrate significant characteristics of people in these health clusters and the differences among the clusters. We considered people in the “Satisfied” cluster as the reference group. We calculated frequency for each health risk factor and derived the percentage in each cluster. The percentage value in the “Satisfied” cluster was used as the base value. We divided the percentage value in each cluster by the base value and multiplied it by 100. As the base point, the index of the average value in the cluster “Satisfied” is equal to 100. If an index is greater than 100, it means that the value of the cluster is higher than the average value of “Satisfied” and indicates a contribution to variation of well-being. In contrast a lower index value indicates that this factor is underdeveloped.
Using this approach, we can measure and map the relative health behavioural determinants of well-being. Depending on the determinant and related key indicator, the trend in the gradient charts reveal how the determinant may bring positive health outcomes. As an example, let us consider the following gradient charts of Socio-Economics among the health clusters.
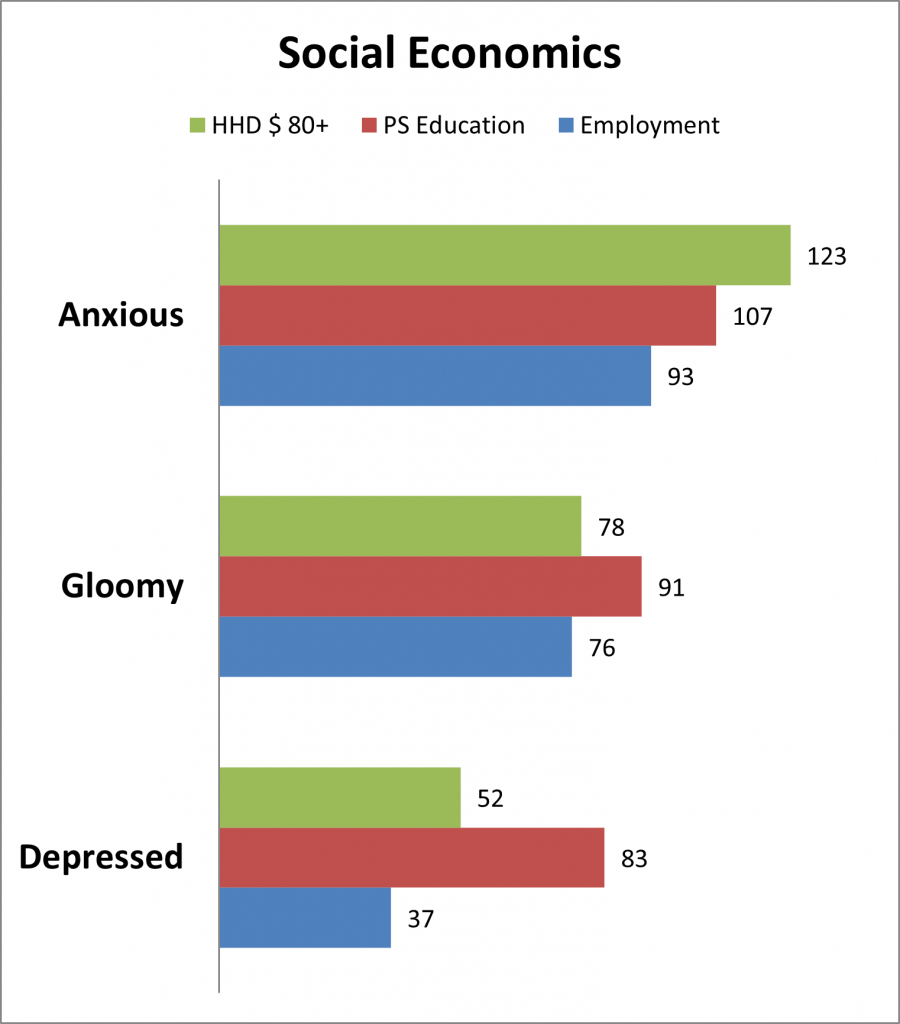
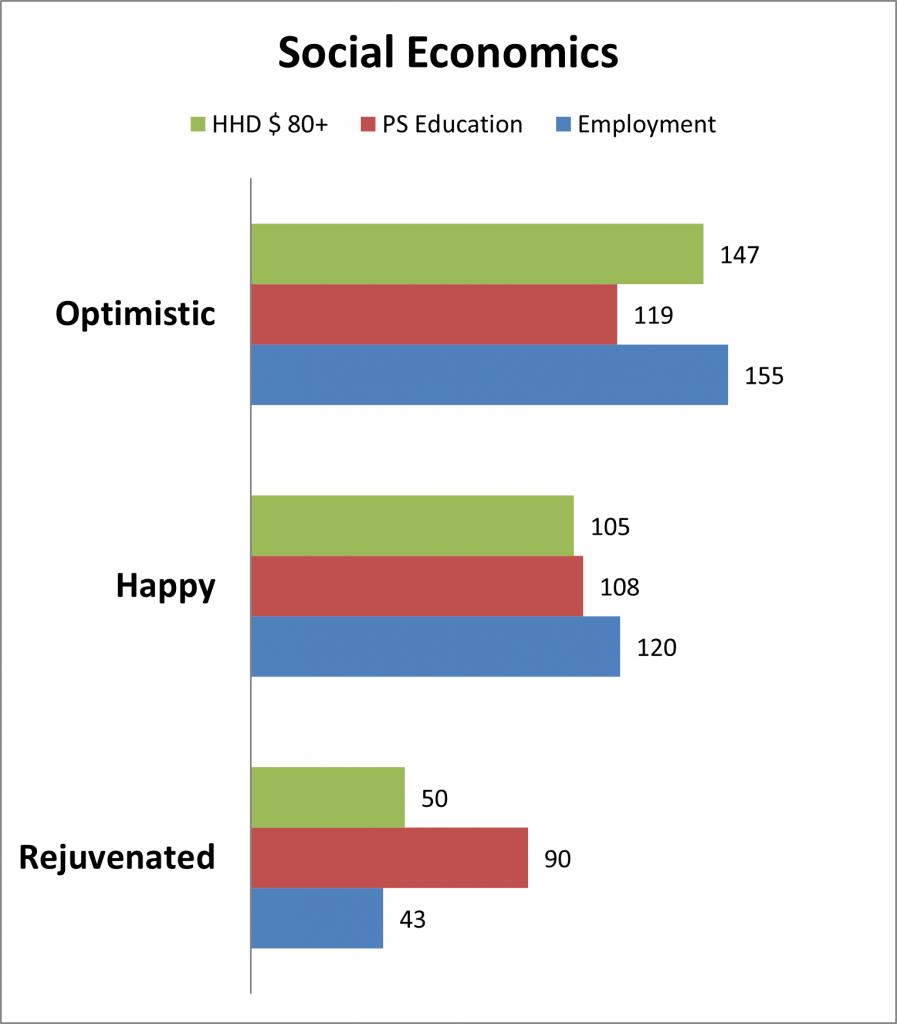
The positive gradients among the indices confirm the trend for households with income over $80K, people with post-secondary education, people with full-time employment. There is a clear and growing positive gradient from “Depressed” to “Anxious” and from “Rejuvenated” to “Optimistic”. The clusters have measurable and meaningful differences and clear relationships. This confirms and quantifies the research by the UK Whitehall studies (HP2020, 2016), (WHO, 2008) and Health Canada (CBPP, 2016) that higher Socio-Economic Status is strongly associated with better outcomes, well-being, and Health Related Quality of Life (HRQoL) of the patients.
Want to know more about key determinants of health? Please do not hesitate to reach out to us at this link!
This is only post 2 of 3 in our series of blog posts related to determinants of health. Stay tuned for the next post!