Vaccine hesitancy is defined by the World Health Organization as a delay in acceptance, or refusal of vaccines despite availability of vaccination services.
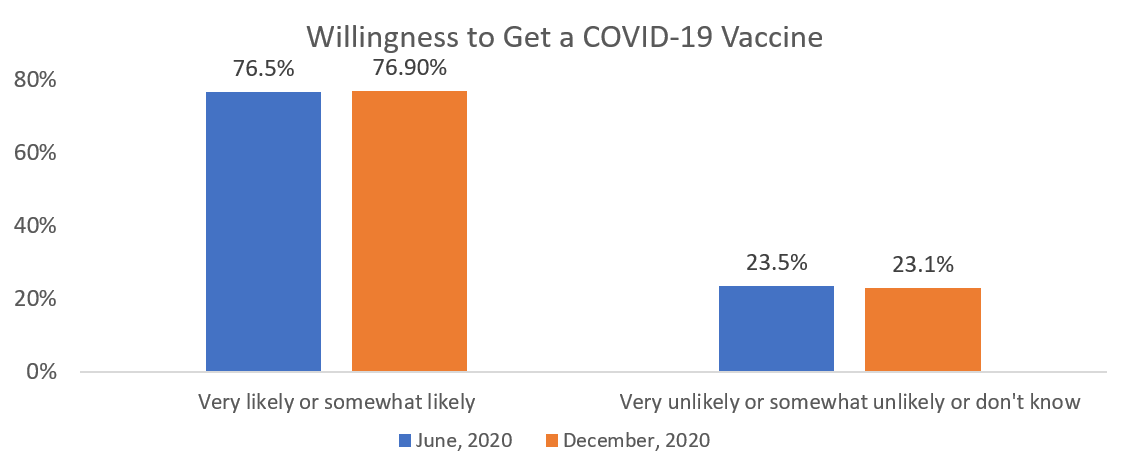
As COVID-19 vaccines are becoming available, Canadians are expected to voluntarily sign up to vaccinate. We can look to countries where vaccinations have been rolled out more quickly like Israel and the U.S., to understand whether COVID vaccination hesitancy may slow down vaccine uptake. While off to a strong start, vaccination uptake in Israel has plateaued and that is because on average, 34% of Israeli citizens were not planning to get the shot1. Similarly, in the U.S., 27% of the public said they probably or definitely will not get the vaccine2. In Canada, we see the same COVID vaccine hesitancy patterns from StatsCan surveys in June and December 2020. 23% of Canadians say they are unlikely to get a COVID-19 vaccine!
Certain groups have higher vaccination hesitancy rates than others and for many different reasons. People have different backgrounds, experiences, beliefs, and circumstances related to COVID-19 vaccination. Moreover, the pandemic and implementation of vaccines are evolving daily. These factors further complicate reasons for vaccine hesitancy.
Introducing our new Covid Vaccine Hesitancy Score
Presently, there is limited current data available about people’s beliefs, behaviour and attitude toward vaccination. That being said, we can use basic geographic and demographic information to gain insights on vaccine hesitancy.
We have created a COVID Vaccine Hesitancy Score by incorporating results from the Canadian Community Health Survey, the Canadian Perspective Survey, our 2021 demographic and geographic data, as well as our webapp Polaris Intelligence.
There are a variety of reasons for not wanting to take the COVID-19 vaccines. Our Vaccine Hesitancy score incorporates the results of Statistics Canada’s surveys on willingness and hesitancy towards the COVID-19 vaccination, as well as the existing comprehensive data on people who do not take flu shots.
| StatsCan Surveys on COVID-19 | Historical data on hesitancy to take flu shots | |
| Reasons |
|
|
We use key characteristics of people who are willing, and hesitant to take COVID-19 and flu vaccinations as predictors for our COVID-19 hesitancy score modelled for all residential postal codes in Canada.
We summarize the key sociodemographic characteristics of those that are not likely to get the COVID-19 vaccines which we use as inputs to determine our COVID-19 Vaccine Hesitancy score.
Age Group
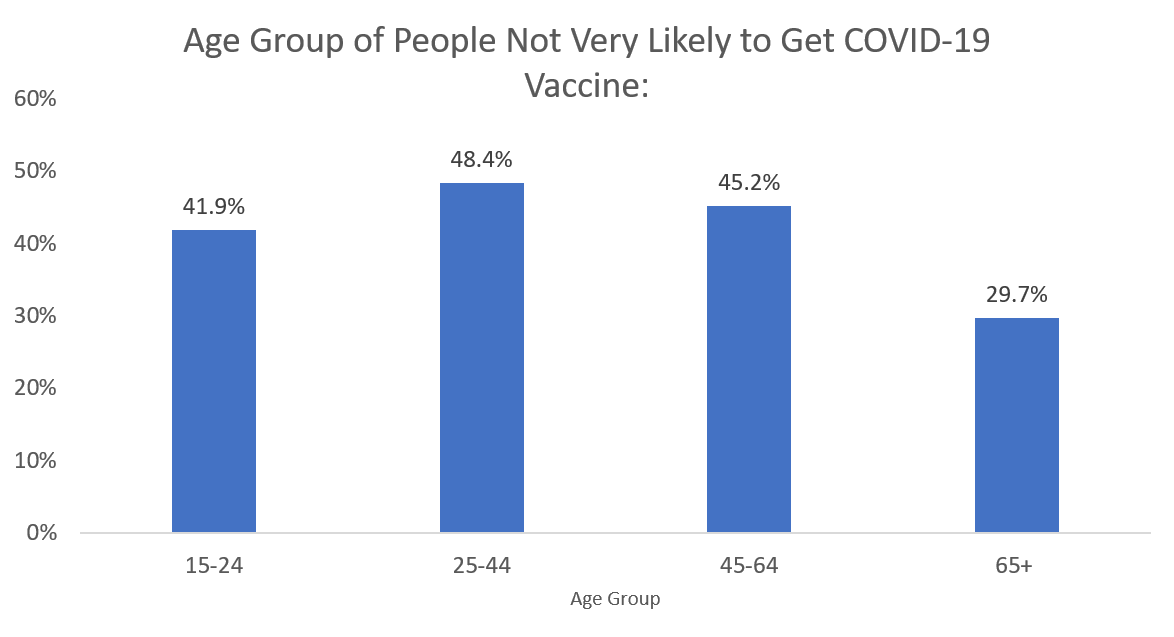
- Seniors (age 65+) have the least hesitancy (29.7%) while young adults (age 25-44) have highest hesitancy (48.4%) towards the COVID-19 Vaccine
Education
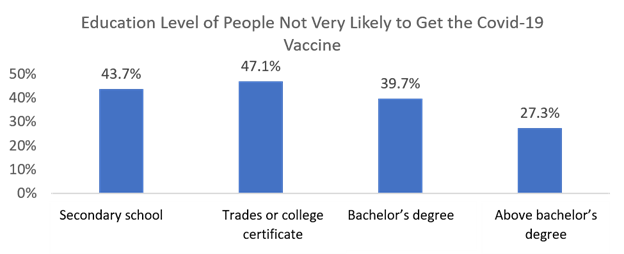
- People with above bachelor’s degree have the least hesitancy (27.3%) while those with college or university certificates below a bachelor’s degree have highest hesitancy (47.1%) towards the COVID Vaccine.
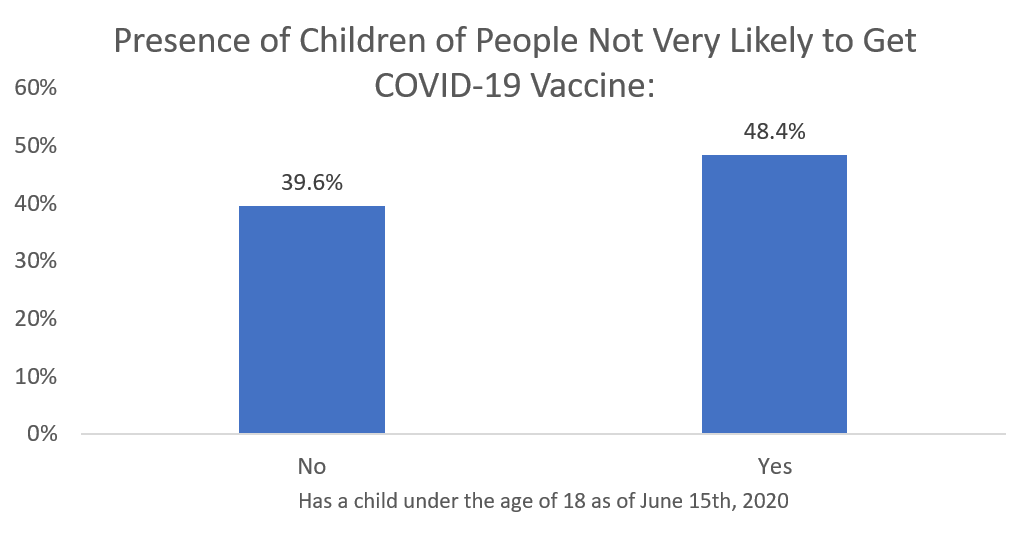
Having a child
- People with children at home have much higher (48.4%) COVID vaccine hesitancy than those without.
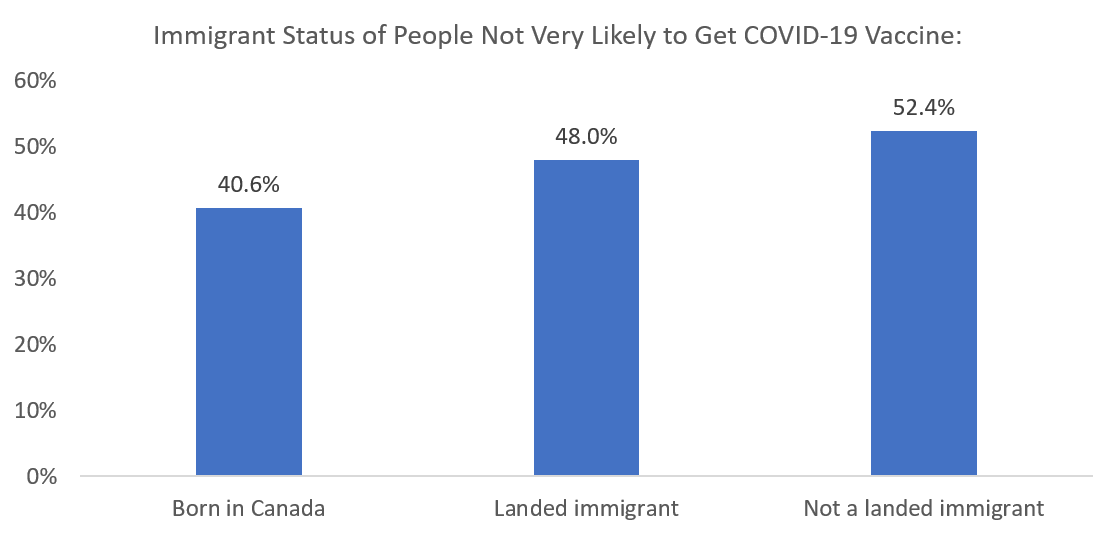
Immigrant Status
- Immigrants (landed or not landed) have a much higher COVID vaccine hesitancy than people born in Canada.
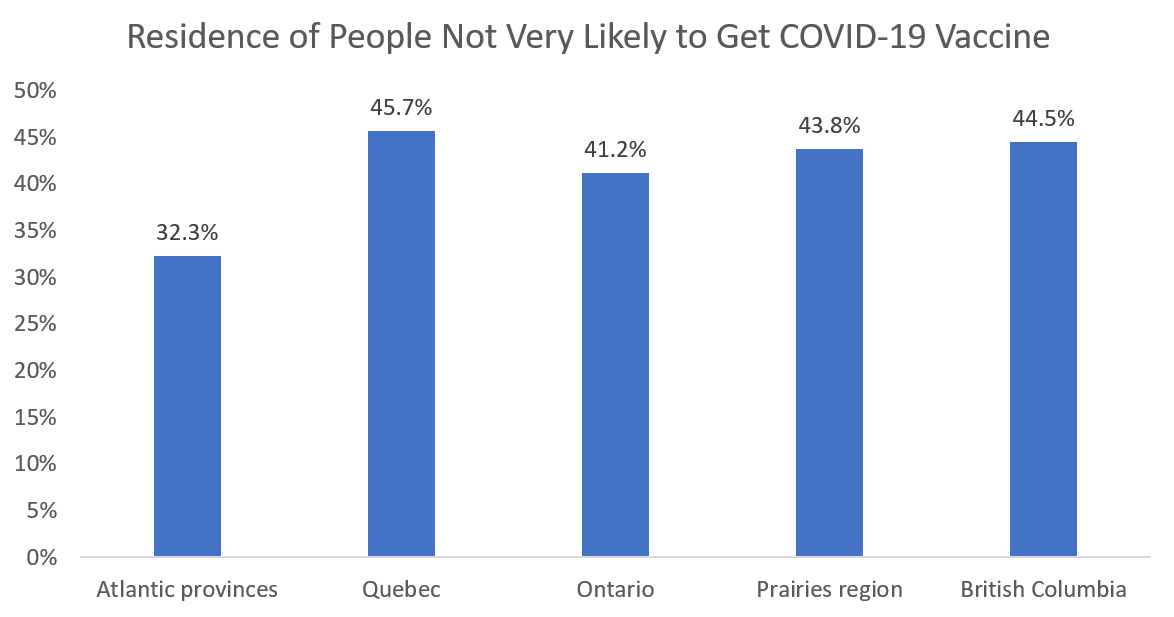
Geography
- The Atlantic provinces have the lowest rate (32.3%) of COVID vaccine hesitancy.
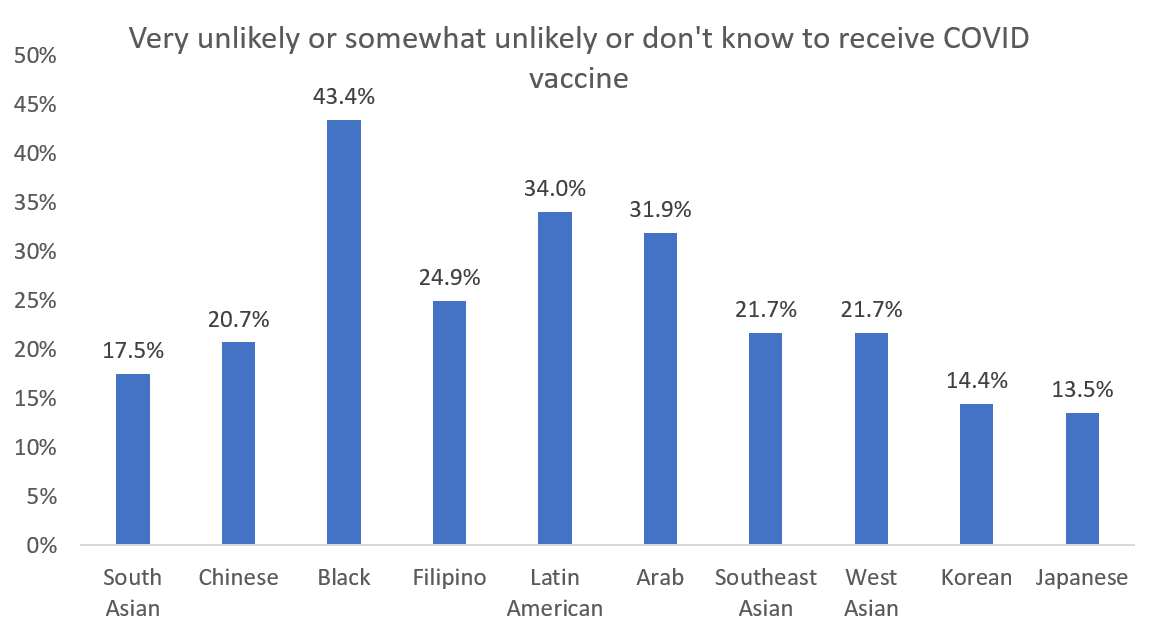
Visible Minority
- Black communities have the highest rate (43.4%) of vaccine hesitancy.
First Nations
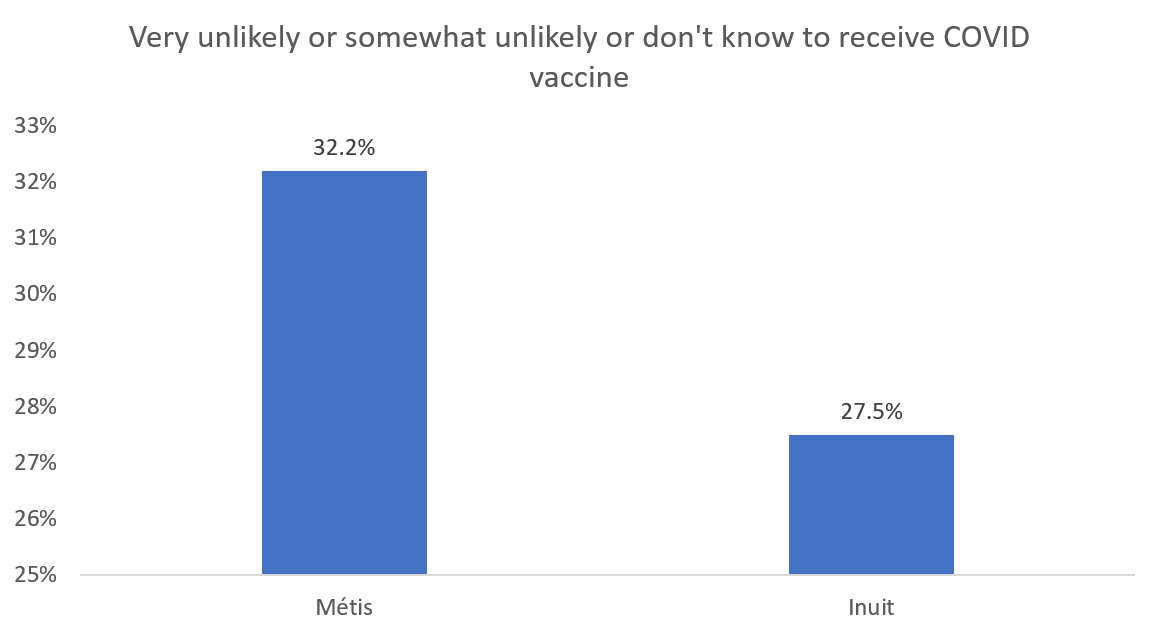
- Among the Indigenous population, Inuit have a much lower rate (27.5%) of vaccine hesitancy than Métis.
Conclusion
Our COVID hesitancy score predicts which areas (down to the residential postal code) are most likely to hesitate getting the COVID-19 vaccination based on the key demographic traits of those that are unlikely to vaccinate. Key demographics include age group, immigrant status, geography, presence of children and other key defining features. To get a highly predictive model, we leverage results from current COVID-19 surveys as well as available historical data on vaccine hesitancy for flu shots.
Our clients are already leveraging the COVID Vaccine Hesitancy Score in different ways!
- Those in the retail, CPG, and tourism industries are just a few that use this data product to target neighbourhoods that have low vaccine hesitancy scores. These neighbourhoods will be the first to return to travelling, shopping, and other leisure activities like gyms and fitness classes.
- Government and healthcare officials can leverage our score in combination with our other demographic and consumer behaviour data to understand which areas have high vaccine hesitancy scores, and how to effectively reach different communities to sway their opinion.
Any questions? Want to learn what household consumption patterns or media usage patterns are like in areas with high COVID hesitancy scores or conversely, the lowest COVID hesitancy scores?
References

